

Build Your Career in GenAI and Digital Innovation
Join 40 million+ NIIT alumni and learners shaping future-ready careers in AI and technology.


Your Learning Journey
Every step brings you closer to your future.
ENROLL
Choose your program and start your learning journey today.
START ORIENTATION
Understand the course structure and set expectations.
LEARN
Experience immersive learning and build in-demand skills.
PRACTICE
Apply your learning through assignments and real projects.
GET HIRED*
Be Interview-Ready, Unlock opportunities. *T&C apply
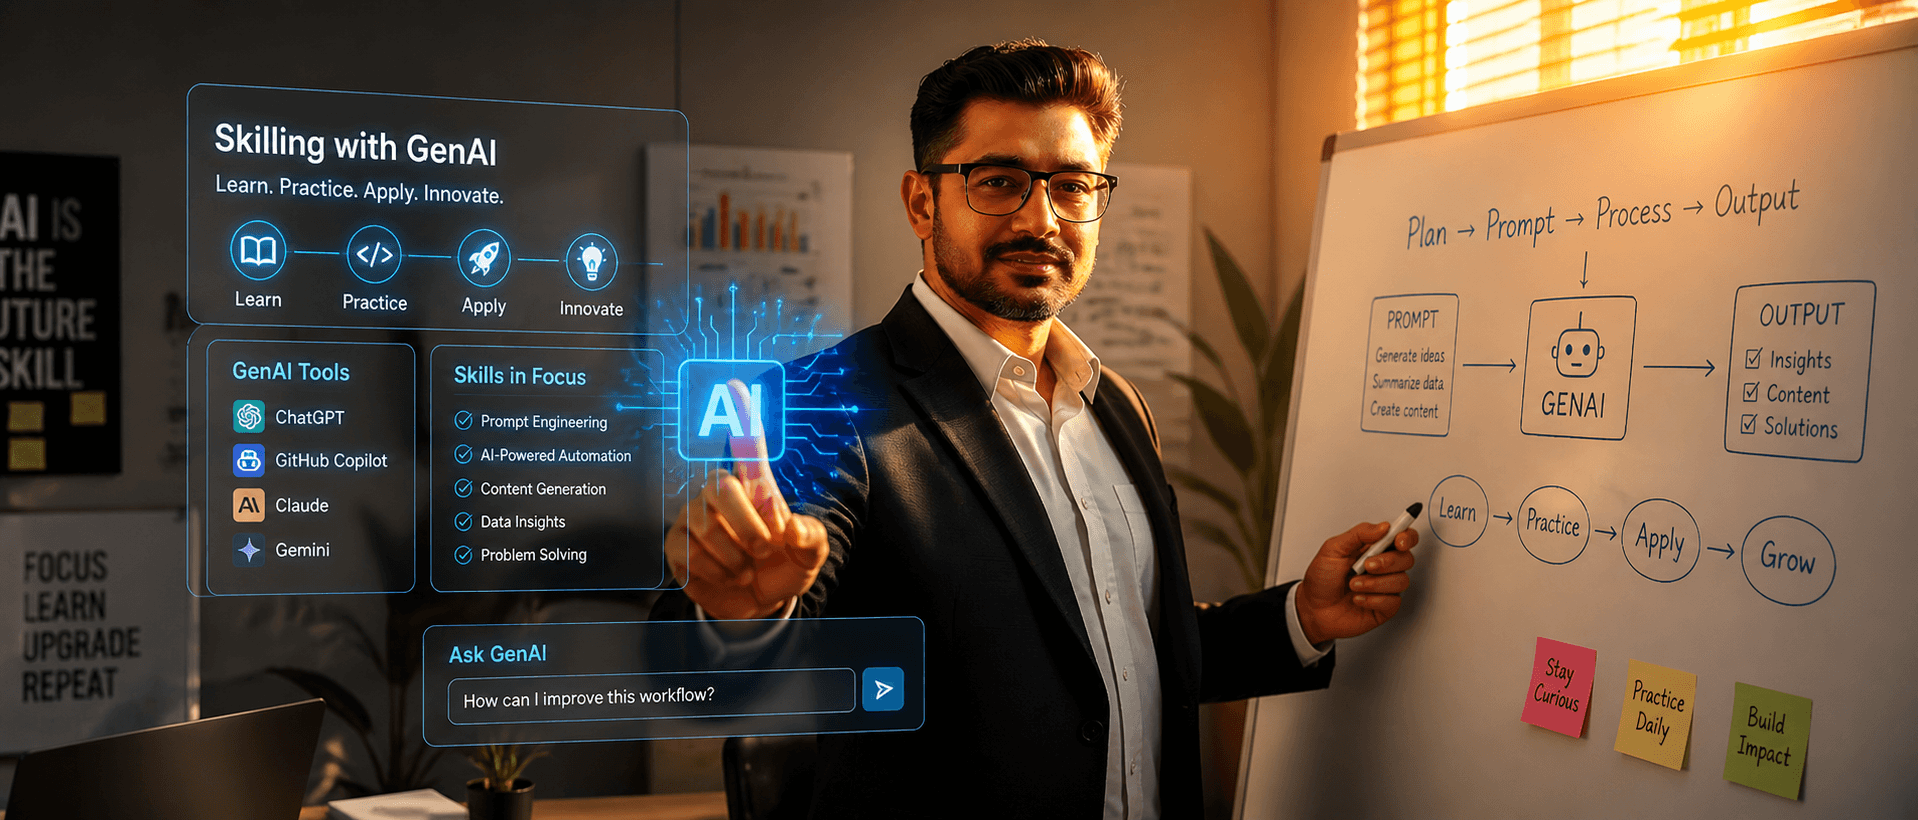
Future-Proof Your Career Path
Learn from Industry Titans
Learn from industry experts who are shaping the future of technology with NIIT’s platform.
The NIIT Advantage
Industry-aligned, mentor-led learning with hands-on GenAI practice to build job-ready skills.
40M+
Students Trained Globally
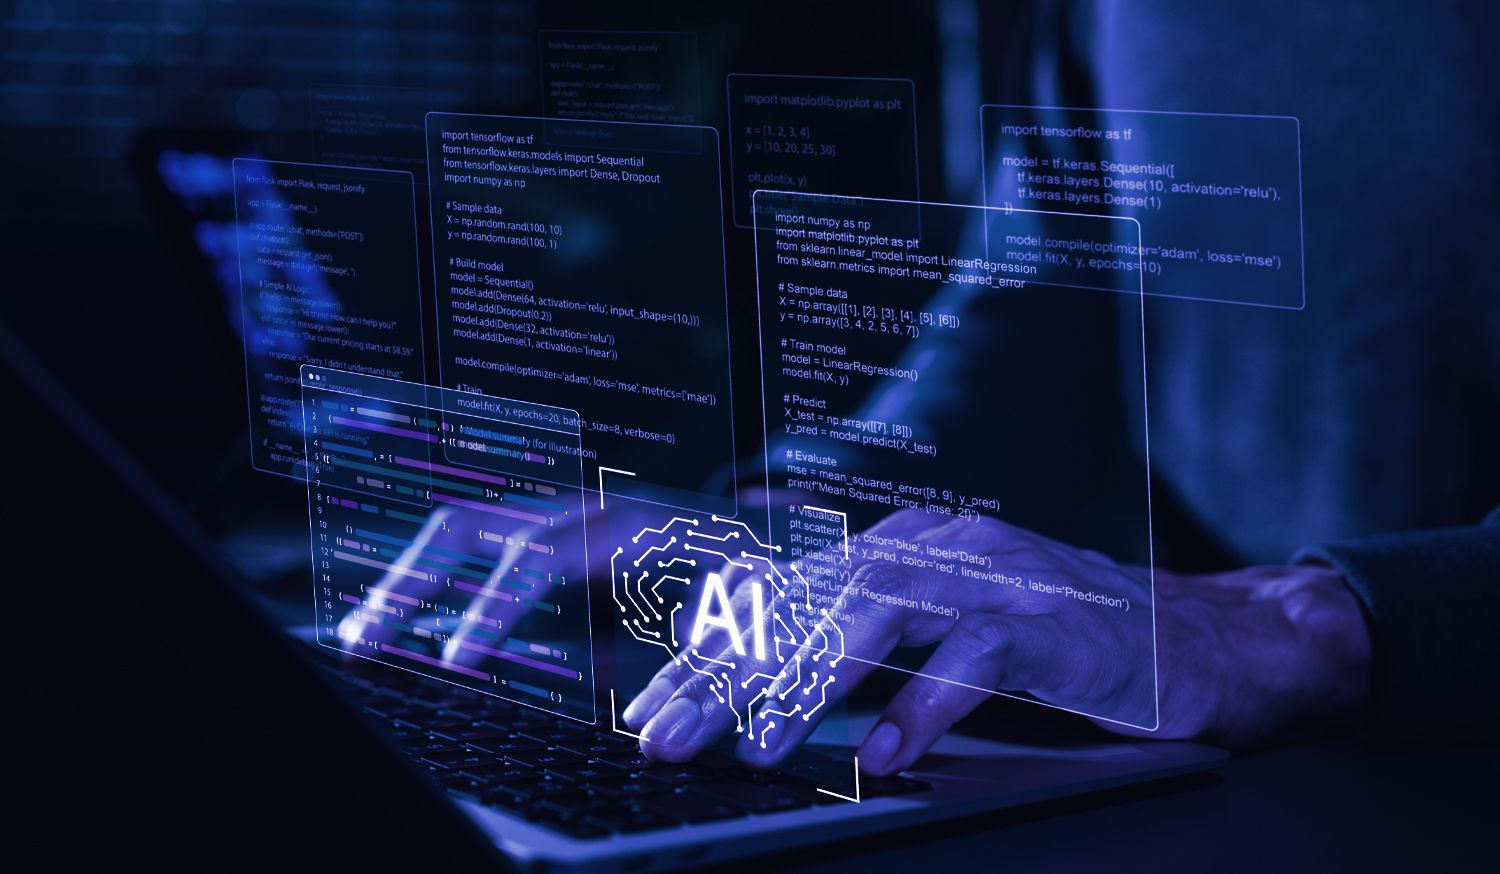
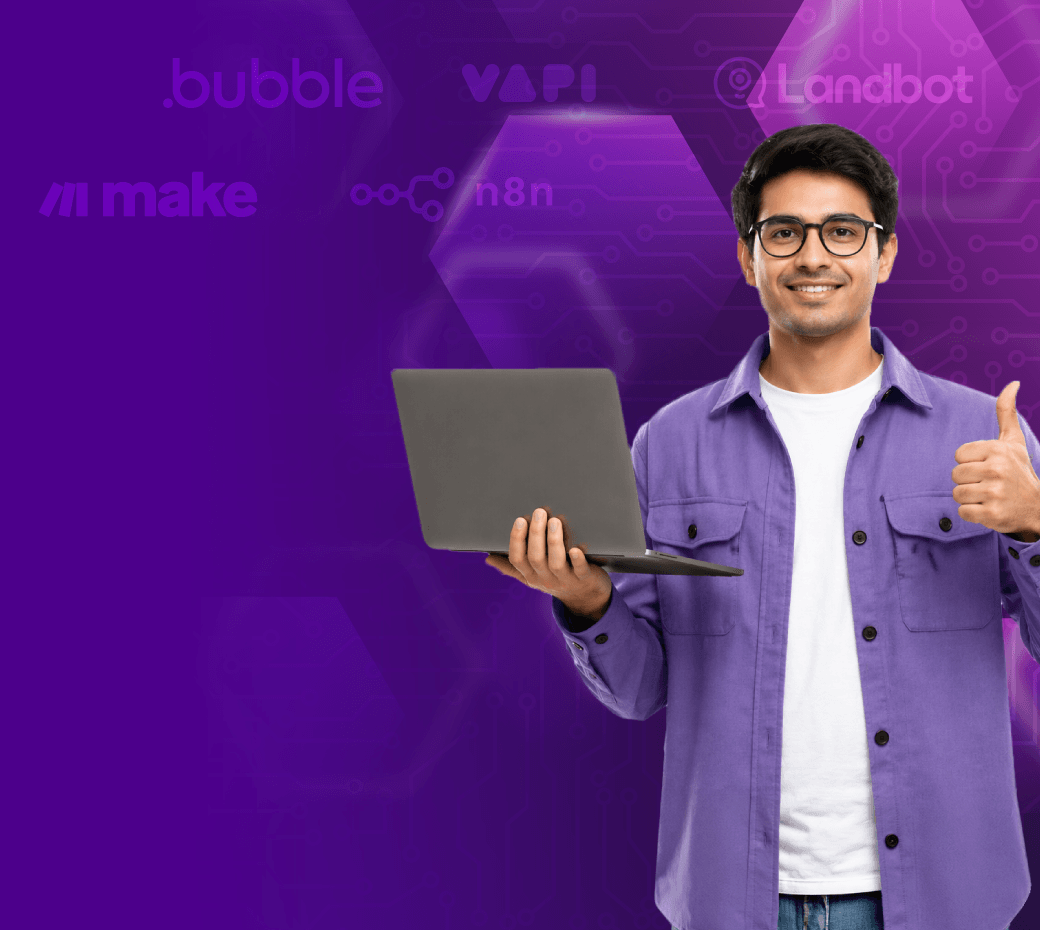
Industry-Aligned Curriculum Focused on GenAI
Learn in-demand skills and Generative AI (GenAI) expertise that top companies are hiring for today.
Data-Driven Program Performance Report
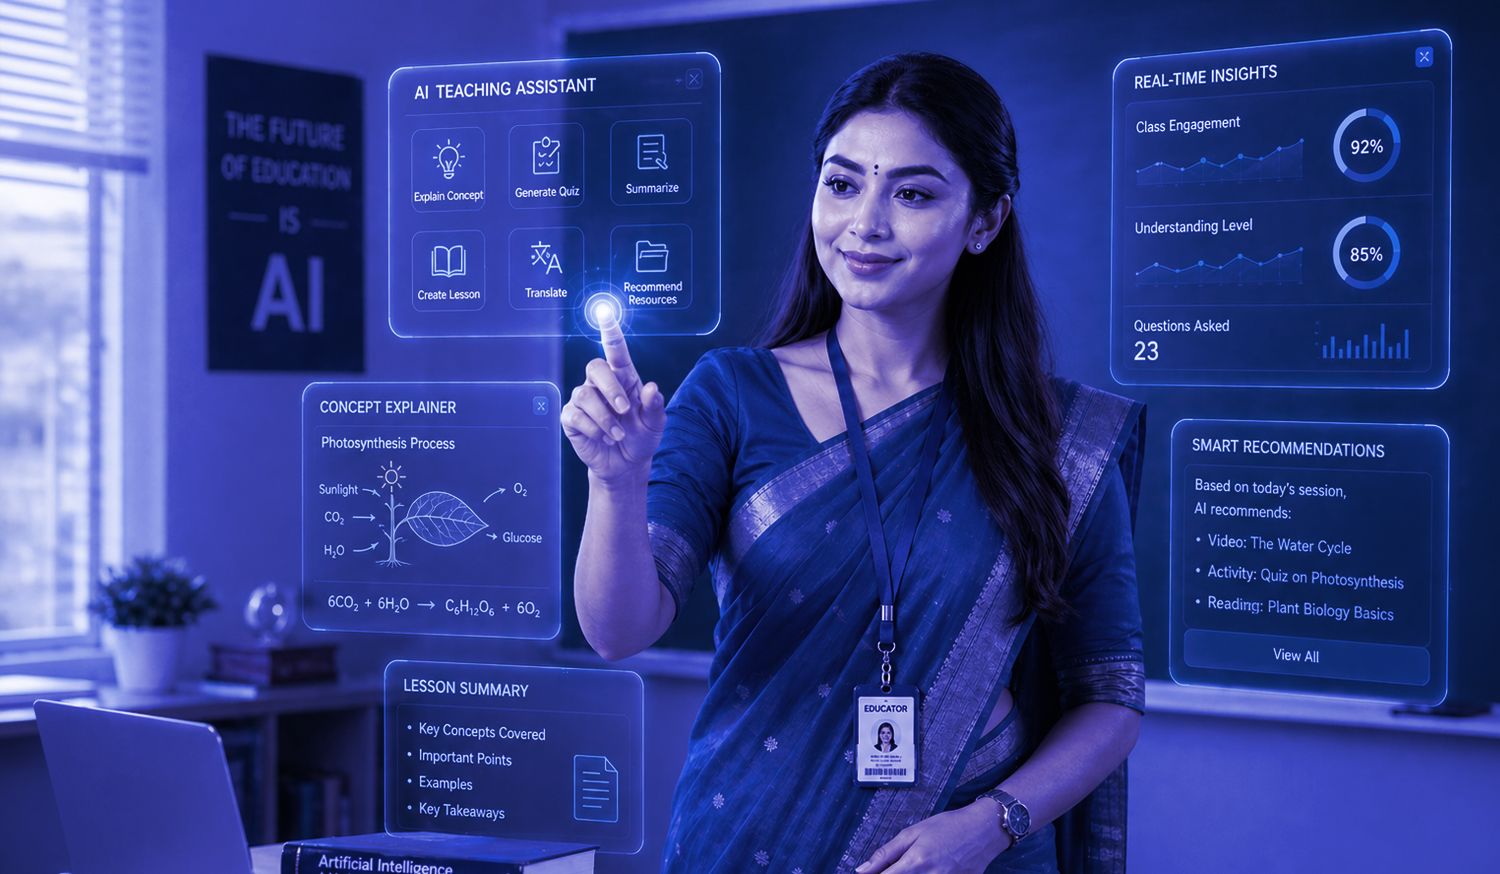
Adaptive learning paths that evolve with your progress, pace, and learning style for better outcomes.
Immersive Hands-On Learning Experience
Practical projects, GenAI-powered simulations, and capstone assignments to gain real-world experience.
Personalized Career Guidance
From skill assessment to expert grooming, everything you need to succeed in interviews.
Mentorship from Industry Experts
Guidance from industry professionals and experienced faculty throughout the program.
50K Hours of Content Developed
Expert-created learning content designed to build practical, job-ready tech and GenAI skills.
Powering Talent for the Digital Age
NIIT has been at the forefront of skills and talent development, transforming lives through innovative learning solutions.
NIIT is a Mission
We will seek to play a key role in the direction and deployment of technology and know-how for the benefit of mankind
NIIT is a Mission
We will grow in the recognition and respect we command, through pioneering and leading in the effective deployment of technology & know-how.
NIIT is a Mission
We will seek to play a key role in the direction and deployment of technology and know-how for the benefit of mankind
The NIIT Group is a leading digital talent development organization, building skilled professionals globally since 1981. Operating in 10 countries, it offers comprehensive learning programs that deliver superior outcomes. The group comprises NIIT Limited (NIIT) and NIIT Learning Systems Limited (NIIT MTS).
In May 2023, NIIT’s Corporate Learning business was transferred to NIIT MTS. This reorganization allows NIIT to focus on its Skills & Careers business, offering learning and talent development programs that accelerate career growth in technology, banking, and other future-ready domains.
Hiring Partners
Lives Transformed
Years of Excellence
Countries, 1 Mission