




Power BI Applied Program
Transform complex data into actionable business insights with interactive dashboards, advanced data visualization, business intelligence, data analytics, KPI tracking, and real-time reporting using Microsoft Power BI.
Program Overview
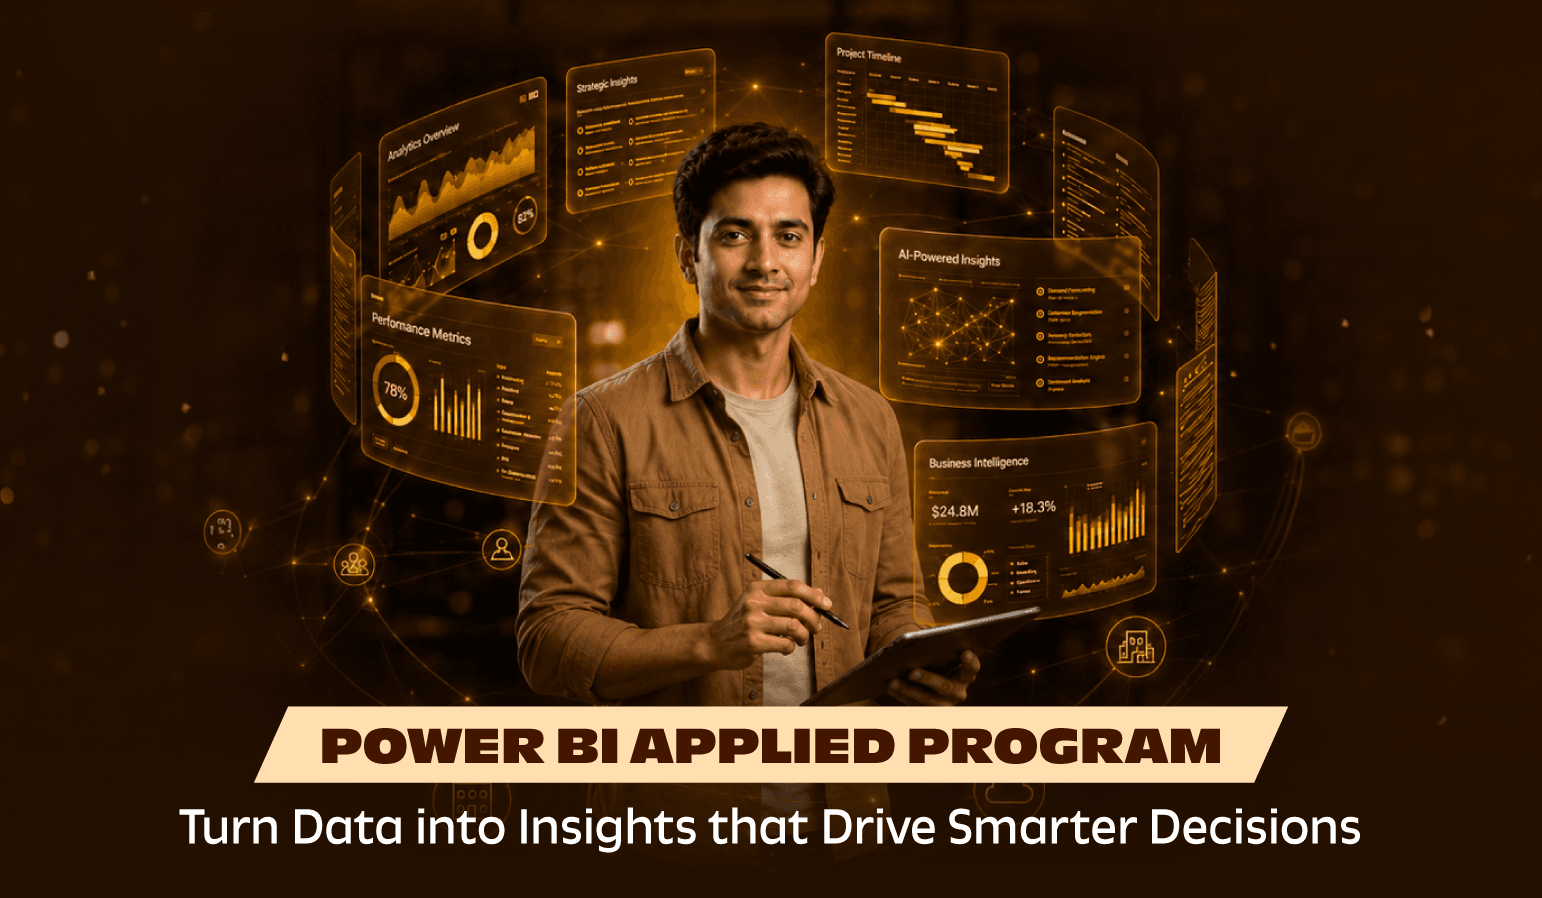
The Power BI Applied Program by NIIT equips learners with the skills to extract, transform, analyze, and visualize data for smarter business decision-making. Participants will learn Power BI, Power Query, DAX, data modeling, and interactive dashboard creation while working with real-world datasets from Excel, CSV, and PDF sources. The program emphasizes hands-on learning, data storytelling, AI-powered analytics, and practical business scenarios, culminating in a capstone project that demonstrates the ability to build impactful reports and actionable insights aligned with Microsoft PL-300 certification objectives.
Curriculum
Comprehensive curriculum to build in-demand tech skills and real-world expertise.
Data Connectivity & Extraction
Learn how to connect to different data sources and extract raw data efficiently.
Data Cleaning & ETL
Apply ETL (Extract, Transform, Load) techniques using Power Query for effective data preparation.
Concept Quiz and Assignments
Dataset Structuring
Learn how to organize and structure datasets for efficient analysis.
Data Preparation
Handle missing values, merge queries, and create hierarchies for optimized data modeling.
Concept Quiz and Assignments
Relationship Building
Create structured relationships between multiple tables.
Performance Optimization
Apply data modeling principles to improve performance and scalability.
Concept Quiz and Assignments
Model Enhancement
Learn techniques to improve model efficiency and responsiveness.
Security & Optimization
Apply security settings and optimize calculations for better scalability.
Concept Quiz and Assignments
DAX Fundamentals
Learn aggregation, logical, and conditional formulas using DAX.
Analytical Calculations
Perform advanced calculations to derive meaningful business insights.
Concept Quiz and Assignments
Advanced Functions
Use advanced DAX functions for complex business calculations.
Trend & Forecast Analysis
Apply DAX for forecasting, trend analysis, and report optimization.
Concept Quiz and Assignments
Visualization Selection
Learn how to choose the right charts for effective storytelling.
Interactive Reporting
Apply interactive visuals and storytelling techniques to enhance data exploration.
Concept Quiz and Assignments
Advanced Dashboarding
Use advanced and custom charts to present deeper insights.
Dashboard Sharing
Build single-page dashboards and share them both offline and online.
Concept Quiz and Assignments
Multi-Page Reporting
Build interactive multi-page dashboards with advanced visuals.
Usability Optimization
Optimize report performance and improve user experience.
Concept Quiz and Assignments
AI-Powered Features
Explore smart narratives, anomaly detection, and AI-driven insights.
Decision Support
Use AI analytics to enhance business decision-making capabilities.
Concept Quiz and Assignments
Business Case Implementation
Build a data-driven dashboard using real-world business scenarios.
Project Presentation & Stakeholder Evaluation
Optimize the Power BI solution, incorporate feedback, and present insights effectively to stakeholders.
Apply and integrate all acquired knowledge and skills to solve a real-world problem and present a complete walkthrough of the approach, implementation, and solution.
Tools & Technologies
Explore industry-relevant tools through hands-on learning to master practical, in-demand skills.
Projects You'll Build
Build production-ready projects to showcase real-world skills and strengthen your portfolio.
Capstone Project
Apply data extraction, transformation, and modeling techniques in Power BI to build a polished, interactive dashboard that delivers meaningful insights and supports data-driven decision-making.
Boost Your Career Visibility
Showcasing a professional Capstone Project on your LinkedIn increases recruiter interest significantly. Build production-ready work that speaks for itself.
Learning Outcomes
Develop industry-relevant skills to create real-world solutions and advance your career.
Extract, clean and transform data from multiple sources (Excel, CSV, PDF) using Power BI.
Model data efficiently to solve business problems and generate actionable insights.
Apply DAX formulas to perform calculations and derive meaningful insights.
Craft compelling data stories using visualization techniques.
Design interactive and user-friendly dashboards for effective decision-making.
Leverage AI-powered insights and automation to enhance data analysis and storytelling.
Industry-Recognized Certification
Certificate of Completion
This is to certify that
Has successfully completed the Power BI Applied Program
Signature
Date
Earn a trusted NIIT professional certificate.
Global Recognition
Accepted by leading employers and organizations worldwide.
Easy Sharing
Add your certificate to LinkedIn, resumes, and professional portfolios.
Career Value
Demonstrates practical skills aligned with industry needs.
Data-Driven Learning, Delivered with Quality
Experience a data-driven learning ecosystem with measurable progress.
Structured Learning Roadmap
Clear learning pathways delivered through our LMS with defined milestones and module progression.
Learner Connect Sessions
Regular live mentor interactions to resolve doubts, reinforce concepts, and maintain engagement.
AI Assisted Faculty Quality Monitoring
AI-assisted faculty performance analysis ensures consistent teaching quality and delivery excellence.
Program Performance Report
Track attendance, assignments, assessments, quizzes, and overall performance with structured progress tracking.
Frequently Asked Questions
Find answers to your queries about the program, curriculum, and admissions.
No academic prerequisites are required-just curiosity and commitment to learning. This program is ideal for students, professionals, and business analysts looking to leverage Power BI for data-driven decision-making.
Participants should have a basic understanding of Excel, SQL, and data handling concepts, along with familiarity with common productivity tools and the Internet. Learners are expected to have access to a laptop with audio and webcam support, possess basic English communication skills, and commit to attending virtual live sessions and completing assignments as scheduled. The flexible online learning format enables participants to build future-ready skills in data analytics, visualization, and business intelligence through structured, hands-on learning.
Admission to the program is direct. Eligible learners can apply by filling out the online application form, submitting the self-declaration and accepting the terms and conditions, and paying the program fee. Admission is confirmed once the payment is successfully completed.
The program follows NIIT’s Mastery Learning methodology, focusing on building one skill at a time through structured, hands-on sprints. Each sprint includes concept introduction through live mentor sessions, individual practice and assignments, mentor review and feedback, and refinement with re-submission of work. Learners typically spend around 4 hours per sprint, with most of the time dedicated to hands-on application and reflection
Applied Power BI program is designed to help learners build industry-relevant skills in data analytics, business intelligence, and interactive dashboarding using Microsoft Power BI. The program covers data extraction, transformation, modeling, DAX calculations, visualization techniques, and AI-powered analytics to enable effective business decision-making. Through hands-on projects, real-world datasets, and a capstone project, learners gain practical experience in creating impactful reports, interactive dashboards, and actionable business insights.
Learners need a laptop or desktop with Intel i3 or AMD Ryzen 3 (or higher), at least 8 GB RAM, and 50 GB free disk space, along with a functional webcam and microphone. The system should run Windows 10 or macOS (or higher) with the latest Chrome or Edge browser, MS Office or equivalent tools, and a PDF reader installed. A stable Wi-Fi or broadband connection with a minimum speed of 5 Mbps is required, and a backup internet connection is recommended.
Yes, learners receive a digital certificate after successfully completing the program and meeting all the required conditions (overall performance score, attendance, payment clearance etc).
Hassle-Free Refund Policy
Your satisfaction is our priority. We offer transparent refund terms for your peace of mind.
100% Money-Back Guarantee
Full refund (excluding the booking fee) if you cancel before the batch starts
Quick Refund Review
Eligible refund requests are carefully reviewed within seven working days
Transparent Refund Timeline
Approved refunds are completed within 45 days for timely settlement
Important: Enjoy a transparent refund policy. Cancel 48 hours before the class start date to be eligible for a refund if you haven’t attended any class.
Tell us your preferred slot
Custom Schedule Assistance
Investment Plan
Secure your future today
Exclusive of 18% GST
Secure your seat with a token booking fee of ₹1,500 today.
Exclusive of 18% GST